

FMS Scoring: How the 0-3 Scale Works, and What Each Score Should Trigger
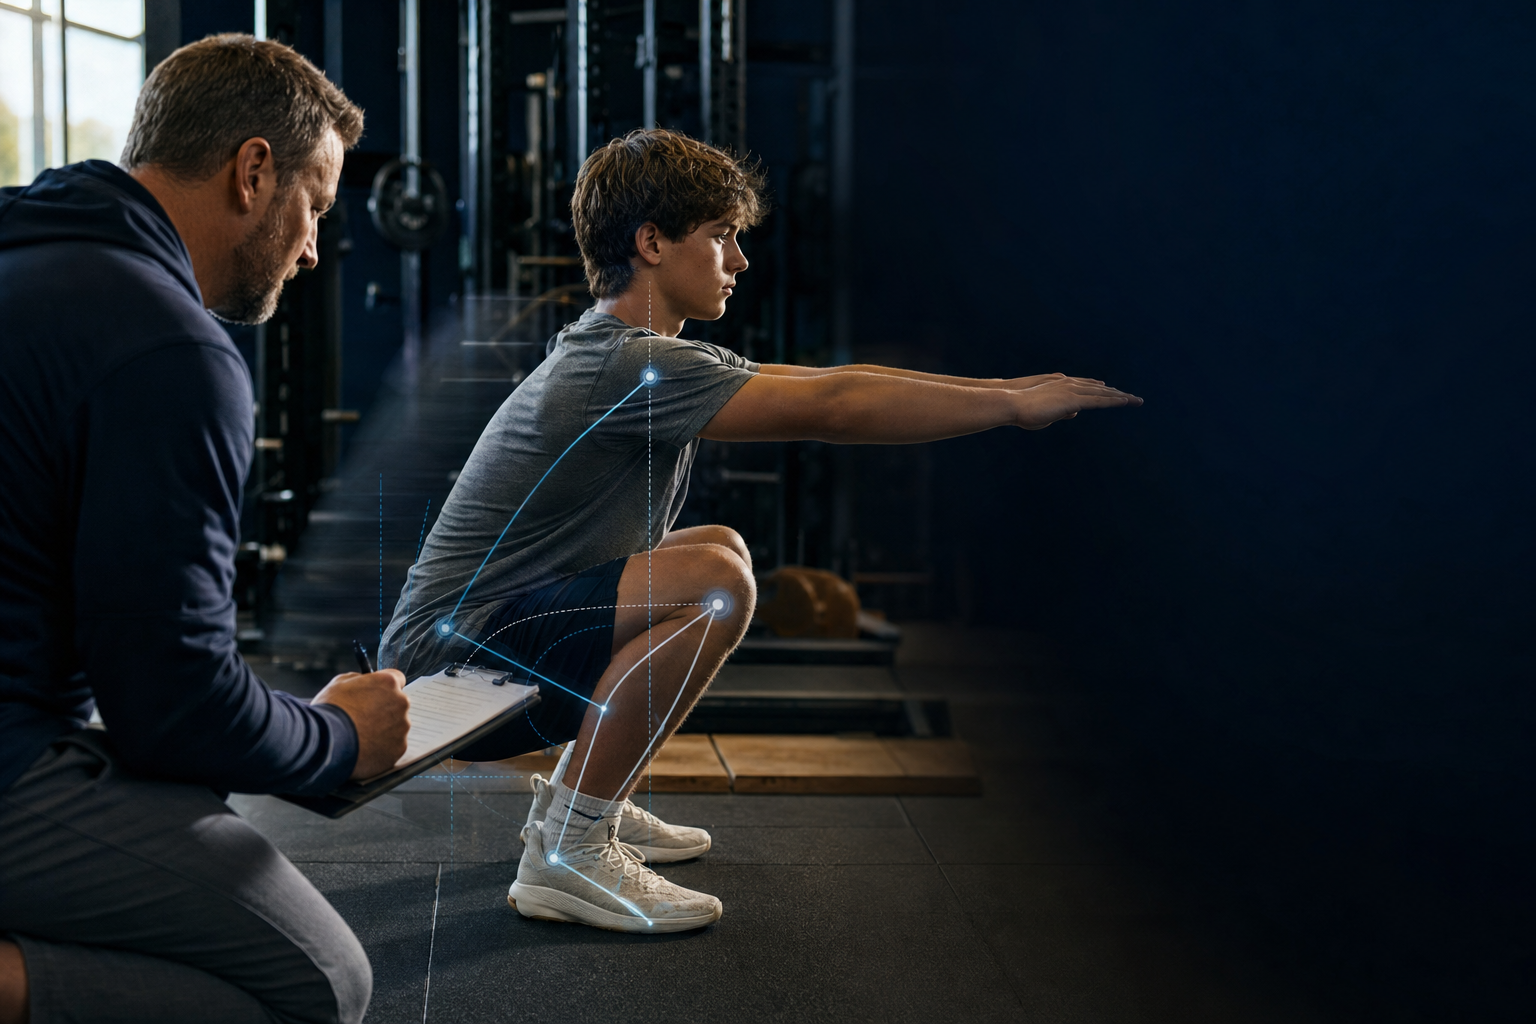
The Functional Movement Screen gives you a number. The number is only useful if you know what each score means and what it should make you do next. Most explanations stop at the scale. This one goes to the decision.
Here is the scoring system and the clearing tests. Then the asymmetry problem the total score hides. Then an honest read on what a low score does and does not predict.
How FMS scoring works, in short
The screen uses seven movement patterns. Each one is scored 0, 1, 2 or 3. Add the seven scores and the highest possible total is 21.
Pain changes everything. If an athlete reports pain during any part of a movement or during that movement's clearing test, the pattern scores 0. The quality of the movement stops mattering at that point.
Five of the seven patterns are scored on each side separately. Under the official scoring procedure, the lower of the two sides is what enters the total. A right-side 3 with a left-side 1 contributes 1, not 2.
The 0 to 3 scale and the seven patterns are standardized, which is what makes the score comparable between screeners.
What 0, 1, 2 and 3 actually mean
This is the table worth keeping open while you score.
| Score | What the athlete did | What it should trigger |
|---|---|---|
| 0 | Reported pain during any part of the movement or its clearing test. | Stop. Refer to a qualified healthcare provider. This is not a programming decision. |
| 1 | Could not complete the pattern, even with compensation. | Coach it and give corrective work on that pattern before you load it. |
| 2 | Completed the pattern, but with compensation or poor mechanics. | Acceptable. Train it and watch it. No reason to hold the athlete back. |
| 3 | Completed the pattern with no compensation against the established criteria. | Nothing. Load it. |
A 0 is categorically different from a 1. A 1 is a training problem. A 0 is pain, and the guidance is to refer that athlete to a qualified healthcare provider rather than hand them corrective exercises.
That distinction gets blurred constantly in the field. A coach sees a low number, assigns mobility work, and moves on. If the low number was a 0, the mobility work was the wrong response.
One more boundary. A screen is not a diagnosis. Scoring an athlete does not clear them medically, and it is not a substitute for an evaluation by a physician or a physical therapist.
The seven patterns, and how the total reaches 21
The seven patterns are built to put an athlete in positions where missing mobility or stability becomes visible.
| Movement pattern | Scored per side? | What it is mainly looking at |
|---|---|---|
| Deep squat | No, both sides at once | Whole-body mobility and stability in a symmetrical, closed-chain pattern. |
| Hurdle step | Yes | Single-leg stance control and stepping mechanics, one side at a time. |
| In-line lunge | Yes | Split-stance control with the trunk loaded in a narrow base. |
| Shoulder mobility | Yes | Reciprocal shoulder range, one arm up and one arm down. |
| Active straight-leg raise | Yes | Hip flexion on the moving leg while the down leg stays extended. |
| Trunk stability push-up | No, a single score | Whether the trunk holds position while the arms press. |
| Rotary stability | Yes | Multi-plane trunk control with the limbs moving together. |
Add the seven scores for the total out of 21. For the five bilateral patterns, record both sides but carry the lower one into the total, per the official scoring procedure.
Record both sides anyway. The per-side numbers are where most of the useful information lives, and the total throws them away.
The clearing tests and the pain rule
Clearing tests are not scored 0 to 3. They are pass or fail. Most of them ask one question: does this provoke pain? The ankle clearing test has two parts, a pain check and a dorsiflexion-range check.
The updated screen uses four: a shoulder clearing test, a spinal extension test, a spinal flexion test, and an ankle clearing test added in the update. Pain on a clearing test zeroes the pattern that test clears, no matter how the movement itself looked.
The ankle test was added for a specific reason. Screening globally, clinicians were missing ankle dorsiflexion restrictions, so the update screens for them directly. If restricted dorsiflexion is the finding, ankle work that actually holds up is the follow-up, not a general mobility circuit.
A clearing test that provokes pain is a 0, and it goes to a clinician. A dorsiflexion restriction with no pain is a mobility finding, so it goes into the programming instead.
Asymmetry: what the composite total hides
Picture two athletes who both come in at 15. One is evenly mediocre across all seven patterns. The other scores 3 on six patterns and 1 on one side of a single pattern. Same total, and almost nothing in common.
The second athlete is the one you can actually do something about. The total score cannot tell them apart.
The screen's own designers treated this as a real gap. The rotary stability pattern was modified in the update because the original version detected only about 15% of rotary asymmetries, while the updated version detects about 37%.
The evidence on whether asymmetry predicts injury splits by population. Across eleven studies pooled in one meta-analysis, asymmetry was associated with injury risk in senior athletes (odds ratio 1.78, 95% confidence interval 1.16 to 2.73). In junior athletes it was not significant (odds ratio 1.21, 95% confidence interval 0.75 to 1.96).
One useful wrinkle from that analysis: asymmetry had higher sensitivity than specificity, which is the opposite of the composite score. In plain terms, asymmetry flags more of the athletes who later get hurt, at the cost of flagging more who do not.
Practical version: write down both sides. If you want the longer discussion of what a movement screen score actually means, that is a separate read.
Will two coaches score the same athlete the same way?
Mostly yes, and this is the strongest part of the FMS evidence base.
In a study of the updated screen, four minimally trained raters scoring video reached an intraclass correlation of 0.95 for the total score. Per-pattern agreement ran from 0.78 on the deep squat, the least reliable of the seven patterns, to 0.96 on rotary stability.
A meta-analysis pooling six reliability studies found interrater agreement of 0.81 (95% confidence interval 0.70 to 0.92) and intrarater agreement of 0.81 (0.69 to 0.92). Different studies, same conclusion. The score is repeatable.
Two caveats before you lean on that. Those raters were scoring video of healthy adults in a controlled setting, not screening a roster in a gym. And the weakest single item was the left ankle dorsiflexion clearing test at 0.63. The authors put that down to viewing problems. Athletes in pants instead of shorts. Heels lifting off the floor. Positions not held long enough to see the end range.
Those are filming and setup failures, not scoring failures. Fix the camera angle and the clothing and most of that disagreement goes away. The same constraints apply to anything else you try to judge from footage, which is covered in what a phone video can actually tell you.
What a low total does and does not predict
Here the evidence genuinely conflicts, and pages that quote only the favorable study are doing you no favors.
The optimistic read: a meta-analysis pooling nine studies found the odds of injury 2.74 times higher at a composite of 14 or below (95% confidence interval 1.70 to 4.43). The same paper reported flaws in the screen's internal and external validity.
The skeptical read: a systematic review appraising 24 studies found that in male military personnel the association at the same 14-point cut-point was real but small, a pooled risk ratio of 1.47 (95% confidence interval 1.22 to 1.77). It found moderate evidence recommending against using the composite score as an injury prediction test in soccer. Its conclusion was blunt: the strength of association does not support using the score as an injury prediction tool.
The reconciling read: effect size depends on who you screen. In a meta-analysis of 29 composite-score studies, the association was larger in senior athletes (odds ratio 1.80, 95% confidence interval 1.17 to 2.78) than in juniors (1.03, 0.67 to 1.59). By sport it was largest in rugby (5.92, 1.67 to 20.92). American football (4.41, 0.94 to 20.61) and ice hockey (3.70, 0.89 to 15.42) came in lower. Neither of those two reached statistical significance.
That same analysis found specificity running higher than sensitivity for the composite score. A low score misses more of the athletes who go on to get hurt than most coaches assume.
So where does that leave the number? The screen is a reliable description of how someone moves today. It is a weak predictor of who gets hurt later. Use it to decide what to coach. Do not use it as a risk ranking, and do not tell an athlete or a parent that a score of 17 means they are safe.
What to do with the scores
Scores move when you train them. A systematic review of six intervention studies looked at core stability work, resistance training, functional training, Pilates and foot strengthening programs, run one to seven times a week for six to eight weeks. Total scores went up in every program, with average gains of roughly 2 to 5.3 points. The review reports those increases as significant, though one foot-strengthening group did not reach significance on its own.
One thing that review does not show, and nobody should claim it does: raising a score has not been shown to lower injury rates. Training the pattern improves the pattern. That is the honest claim.
The operational problem is rarely the screen. It is the follow-through. You screen twenty athletes. Five flag on one side of one pattern. Three weeks later nobody knows who actually did the corrective work.
That is a tracking problem, and Greater lets you assign the corrective work to the athletes whose per-side scores flagged and see who completed it instead of chasing a clipboard. If you are weighing software for the screen itself, what an FMS app does and how to choose one covers that question.
Building your scoring sheet
The official scoring criteria, the measurement setup and the standardized instructions come from the FMS Level 1 manual and the certification course. This page is not a substitute for either, and a sheet you build yourself does not change that.
What a usable sheet needs on it:
- Athlete name, date, and screener name. Knowing who scored a screen is what lets you check a later re-screen against it.
- One row per movement pattern, in a fixed order.
- Left and right score columns for the five bilateral patterns: hurdle step, in-line lunge, shoulder mobility, active straight-leg raise, rotary stability.
- A single score column for the deep squat and the trunk stability push-up.
- A pass or fail box for each of the four clearing tests.
- An asymmetry flag column, checked whenever the two sides differ.
- A total out of 21, using the lower side for the bilateral patterns per the official scoring procedure.
- A notes column. The number tells you there was a compensation. The note tells you what it looked like, which is what you program against.
Re-screen on a schedule rather than after an incident. Preseason and mid-season is a reasonable baseline for a team, and an intervention study window of six to eight weeks is a reasonable interval if you are tracking a specific correction.
Score it once. Then track what happens next.
Assign corrective work to the athletes who flagged, and see who actually completed it.
Try GreaterFrequently asked questions
What score should trigger action on the FMS?
Per pattern, not per total. The scale treats a 2 or a 3 as acceptable and a 1 as something to coach, so the triggers are any 1, any difference between the two sides, and any 0. There is no validated 'good' total. The widely quoted 14-point cut-point comes from injury-prediction research, and that research conflicts: one meta-analysis found 2.74 times higher injury odds at 14 or below, another concluded the association is too small to support using the score as a prediction tool.
What does a score of 0 mean on the FMS?
A 0 means the athlete reported pain during the movement or during that movement's clearing test. The published guidance is to refer that athlete to a qualified healthcare provider rather than assign corrective exercise. A 0 is not a worse version of a 1. It is a different category of finding.
How is the FMS total out of 21 calculated?
Seven movement patterns, each scored 0 to 3, added together for a maximum of 21. Five of the seven patterns are scored on each side separately, and under the official scoring procedure the lower of the two sides is the score that enters the total. The deep squat and the trunk stability push-up each produce a single score.
Does a low FMS score mean an athlete will get injured?
No. The evidence is mixed and the effect is small in most populations. A systematic review of 24 studies found only a small association in male military personnel and recommended against using the score as a prediction test in soccer. A later meta-analysis found the association varies by age and sport, and that specificity runs higher than sensitivity, meaning a low score misses many athletes who later get hurt. Treat the score as a description of movement, not a risk ranking.
How long between FMS re-screens?
On a schedule, not in reaction to an incident. Preseason plus mid-season works for most teams. If you are tracking a specific correction, six to eight weeks is a reasonable interval, since intervention studies that moved total scores ran for that long.